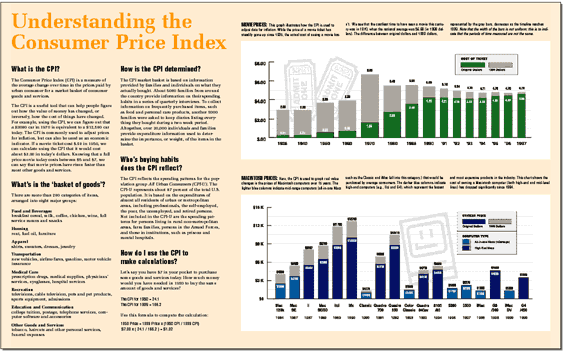
I chose to explain the CPI because it was a very dull and academically neutral subject for me to test my skills on. The information on the 21x13 in. poster came from a 30 page government brochure.
Click to download PDF version [132K]
| mapping & diagramming : the consumer price index | ||
 |
||
|
The final project done for Mapping & Diagramming. The class was essentially a independent study
in information design; we individually decided on an area of interest that we wanted to explore in
the form of a map or diagram.
I chose to explain the CPI because it was a very dull and academically neutral subject for me to test my skills on. The information on the 21x13 in. poster came from a 30 page government brochure. Click to download PDF version [132K] |
||
| index | ||